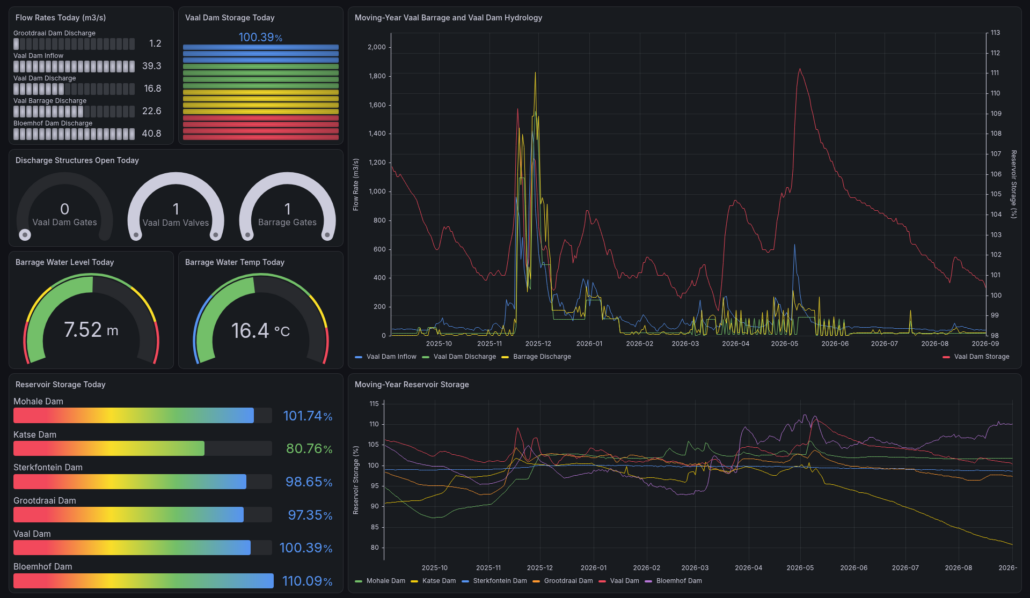
VBHydrology has developed a new Desktop Dashboard for the Vaal Dam and Vaal Barrage Daily Flow data.
The dashboard view is designed specifically for desktop or laptop use. It does work on mobile, but line graphs become condensed horizontally making the reading of data difficult.
The graphs are fully interactive meaning that you can drill down by using your mouse to select a range on the graph. To return to the full year’s data display, click on the orange SAST button at the top right of the screen and select 1 year from the dropdown menu.
Also, use your mouse to hover over the graph and it will show you the data in a small popup window. Then, move your mouse across the graph and the data will update in the popup window automatically.
Click on the image below which will take you to the Desktop Dashboard page. Add it as a Bookmark to your browser for easy access.